Introduction. Unfortunately, by the prevalence of kidney disease, especially the End-Stage Renal Disease (ESRD) [1], there are only two options, dialysis or kidney transplantation [2].
Nowadays, kidneys provision from deceased donors and non-family members, makes renal transplantation more feasible, but the main problem is the rejection of the transplanted kidney. In these conditions, the medical team decides whether the kidney transplantation is the best option. To make a better decision, they use their own personal experiences, the patient’s record and a set of medical standards. Some graft survival risk factors (features) are: Donor and recipient relationship, donor statues (live [3] or deceased donor), recipient and donor weight, height [4], BMI (Body Mass Index) [5], age [6], gender and gender matching [7], race and ethnicity [8, 9], cause of ESRD [10], HLA (Human Leukocyte Antigen) typing [11, 12], immunological factors like presence of antibodies against lymphocytic antigens, presence of antibodies like cytotoxic in blood donors, histologic findings [13-16] and pathological abnormalities [17], serum creatinine [12, 18-20], estimated Glomerular Filtration Rate (eGFR) [13, 21], recurrence of glomerulonephritis, amount of urea, urinary infection [22], Retinol Binding Protein (RBP) and albumin content of urine [23], length of preoperative witting time [24] and dialysis time [4, 24-28], reversible kidney disease, malignancy and active neoplasm, active acute or chronic infection such as cytomegalovirus [4], Chronic Allograft Nephropathy (CAN) [29, 30], vitamin D levels in donated kidney(s), surgical procedures, Cold Ischemic Time (CIT), position of kidney (left or right), level and type of immunosuppression drug [31], active vasculitis, severe lung or cardiovascular disease, blood group [32, 33], coagulation, hypertension, level of hemoglobin and hematocrit, hyperlipidemia, severe chronic liver disease, substance abuse, uncontrolled psychiatric disorders, smoking status, patient non-compliance, operation room conditions, transplantation center [3, 31, 34-38], nurse and physicians conditions, hospitalization time and other donor related risk factors like donor cerebrovascular cause of death, history of hypertension, donor elevated creatinine or donor history of Acute Kidney Injury (AKI) [39] .
Obviously, there are other risk factors not mentioned above. Previous studies have focused on some of the above features and sometimes their results contradict each other. For example some studies [13, 21], have used creatinine as a risk factor, but some studies state that the predictive power of creatinine is not sufficiently precise, because creatinine cannot precisely predict GFR (Glomerular Filtration Rate) [40].
Due to the variety of effective factors, it is difficult for a physician to predict the transplantation result. In addition, some of laboratory tests are costly and time-consuming as well as requiring lab equipment. Hence to save time, cost and accuracy, it is beneficial to apply Machine Learning (ML) techniques to predict transplantation outcome. There are some publicly available decision-making tools and risk calculators [9, 41-43], but their performance is limited.
Methods such as Cox model [44], machine learning techniques [4, 19, 45-49] like decision tree [49, 50] and neural networks [51] have been used to predict the renal transplantation outcome.
In general, renal transplantation survival prediction studies can be classified into three types, short-term, mid-term, and long term. In recent decades, the use of immunosuppressive drugs such as cyclosporine has reduced the renal transplant rejection, which necessitates prediction of long-term transplant survival [52-56].
In this article we have Artificial Neural Networks (ANN) model. Moreover, we have used a set of different features compared to the literature. The data set has been collected from patients’ record within 10-years, which included both acute and long-term rejections.
Materials and Methods
Data collection
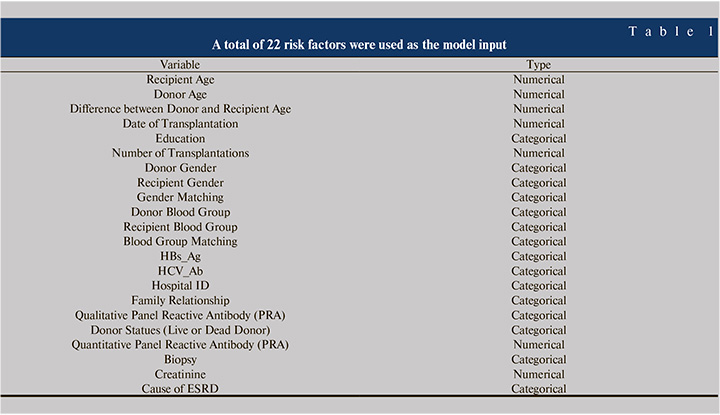
The dataset was extracted from records of 4572 patients who had one or two kidney transplantations in Tehran’s Shahid Labbafinejad and Baqiyatallah Hospital. The confidentiality of the data was maintained and the study was approved by the ethics board of Shahid Beheshti University of Medical Sciences (No: IR.SBMU.MSP.REC.1397.518). Demographic variables, clinical features and laboratory parameters such as creatinine, HBsAg (Hepatitis B surface antigen), HCV-Ab (Hepatitis C Virus Antibody) (Table 1) were used as inputs to the ML models. After removing the outliers and replacing missing fields, a total of 3544 records had a final transplantation status, so these records were selected for the study. 1037 transplants were rejected, and 2507 cases were survived, so the number of survived cases was approximately 2.4 times the rejected cases. Mean and variance of recipient age are 36.70 and 231.1 years respectively. Mean and variance of donor age were 26.7 years and 41.3 years respectively. The gender of 2269 recipients were male and other 1275 cases were female. The rejection percent in both male and female cases was 29%. 1772 of selected were from Baqiyatallah hospital and 1772 cases were from Shahid Labbafinejad hospital.
About 20% of total data was used as the test data and other 80% of data was used to train the ML algorithm. In order to have a correct evaluation of the proposed methods, the same number of rejected and survived records were selected in the test stage.
Some features represent similarity between donor and recipient, such as age, gender, and blood group [5], the incompatibility of donor and recipient in these features is defined as a new variable, for example, the difference between donor and recipient age is defined as a new variable. Previously, features like cause of ESRD or difference between the age of recipient and donor were not considered. Finally, records were randomly shuffled.
But in this study, the target or the output of the model is the status of transplantation (survived or rejected). Rejected cases are shown with number 1 and survived ones are shown with number 0.
Neural Networks Model
Although, software such as SPSS™ and Weka have a neural networks toolbox, but we used MATLAB®, which includes a powerful neural networks toolbox. Training, validation and test data percentage portion was about 72,8, 20 percent respectively. For a good evaluation, it is better to be 50% of test data negative and 50% positive cases. If the number of positive and negative samples were not the same, we can’t have a strong inference of the ML performance. The symmetric sigmoid transfer function was selected as the neuron transfer function with the following equation:
Equation 1
A Bayesian regularization backpropagation was used as a MATLAB® option for training method and the number of hidden layers was set to one. The designed network had one input and one output layer, and MSE (Mean Squared Error) criteria was used to measure the performance of the neural network.
Feature Importance
A LOFO (Leave One Feature Out) were used to identify the most important features (risk factors) for prediction of renal transplantation outcome.
Results
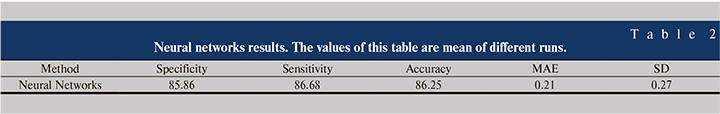
Table 2 shows an abstract of the results of this study. According to this table, by means of neural networks, it is possible to predict the outcome of renal transplantation with approximately 86% accuracy, sensitivity and specificity. Mean Absolute Error (MAE) is about 0.21 and Standard Deviation (SD) of errors is about 0.27.
Firstly, a neural networks with two opposite targets (rejected and functioning transplant) with one hidden layer was used. The studied dataset was unbalanced, hence imposed a bias on the output of neural network, therefore, we set the threshold of classification to eliminate the bias (Figure 1).
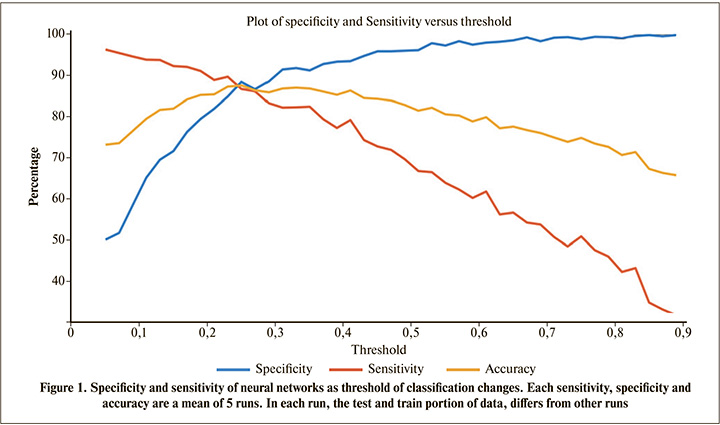
Generally, the classification threshold is set to 0.5. Using this threshold value, the sensitivity is about 65% and specificity is about 97% (Figure 1). From a clinical point of view, sensitivity and specificity have special meanings [57, 58], and each оf them can be maximized based on the preference. But, here, a threshold resulting in an equal sensitivity and specificity were selected. It can be seen in Figure 1 that threshold values near 0.25 make classification accuracy, sensitivity and specificity, all equal to 86%. To ensure that the threshold of 0.25 does not change with different test and training subsets, different test and training sets were selected and then the mean of the corresponding thresholds was obtained. It was found that thresholds around 0.25 result in the sensitivity, specificity and accuracy equal to each other.
Results of each run of neural networks slightly differ from other runs, because the test and train and validation data were randomly selected. Table 2 shows the classification results of neural networks with a threshold of 0.25 for 10 runs.
As it is seen in Table 2 the overall accuracy is approximately 86%. The test ROC (Receiver Operating Characteristic) plot is shown in Figure 2. According to Figure 2, the ROC curve has an Area Under Curve (AUC) of 0.93, indicating an efficient prediction the graft outcome.

Figure 3 shows the output histogram of the neural networks for test data, before applying the threshold, showing a bimodal distribution. Rejected cases are distributed around 1 and survived cases are distributed around 0.
Important risk factors
Often. in a clinical study, we are interested to know which variable has a greater contribution on the output [5, 59]. To accomplish this end, A LOFO method was conducted in which the input variables were deleted one by one, and then the sensitivity, specific and accuracy of the model were examined. Deletion of a more important input variable results in more reduction of the prediction performance.
As previously mentioned, a threshold of 0.25 with the neural networks model resulted in all the sensitivity, specificity and accuracy equal to 86%. Table 3 shows the effect of deletion of each of 22 features on the performance of the model. The most decreases related to the most important features.
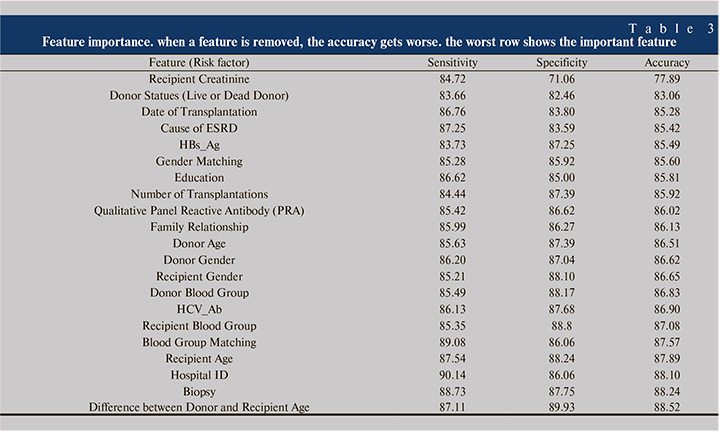
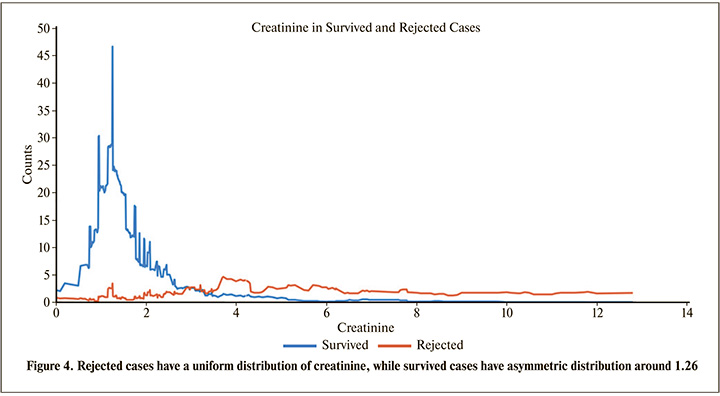
According to Table 3, removing recipient creatinine in the model, has the strongest effect on the sensitivity, specificity and accuracy, therefore it can be concluded that the recipient creatinine is the most important parameter that affects the transplantation outcome. Although there are other biochemical parameters associated with renal failure, besides creatinine, but recipient creatinine is an indirect representative of parameters such as glomerular filtration rate, hence it can be an important risk factor of renal transplantation rejection. As it can be seen in Figure 4, transplants of patients with creatinine up to slightly less than 3 are more likely to be survived than the patients with creatinine more than 3.
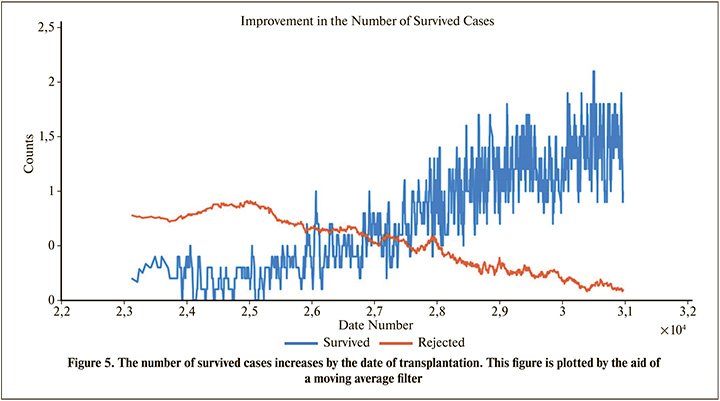
According to Table 3, we can regard Donor Statues (Live or Dead Donor) and Date of Transplantation as the next important features. Although, there may not be sufficient information about the last transplantations, but Table 3 shows that the date of transplantation has a considerable effect, because as shown in Figure 5, the number of survived cases increases by the date of transplantation.
Discussion
The proposed method predicted the transplantation outcome with about 86% of accuracy, sensitivity and specificity which is higher than previous studies [42, 60, 61]. The AUC of the neural networks was near 0.93, indicating an efficient prediction compared to similar studies [42, 62].
By changing the classification threshold, it is possible to achieve the desired sensitivity at the expense of the specificity, and vice-versa (Figure 1). This flexibility, helps both the patient and clinician to make the best decision based on the current situation.
As described in the Result section, the patient’s creatinine is the most important feature affecting the transplantation outcome. According to Table 3, Statues of Donor and Date of Transplantation are next important features. Results of Table 3 is compatible with other works. For example, previous studies emphasized that the probability of transplant rejection from living donor is less than deceased donor [38]. Similarly, Table 3 indicates the importance of the effect of living donor (Donor Status). Previous studies show that the probability of graft failure decreases by the year of transplantation (Perhaps due to medical advances or another unknown parameters) [5],
To compare the results of Table 4 with previous work, MATLAB® Filter Feature Selection Toolbox was applied, which calculates the importance of features by Relief-F [63, 64], Pearson Correlation Coefficient (PCC) [65], Term Variance (TV) [66] and Neighborhood Component Analysis (NCA) [67] feature selection methods. Relief-F and NCA are calculated by the fscnca and relief MATLAB® functions, respectively. Table 4 shows the importance rank of risk factors calculated by the named methods.
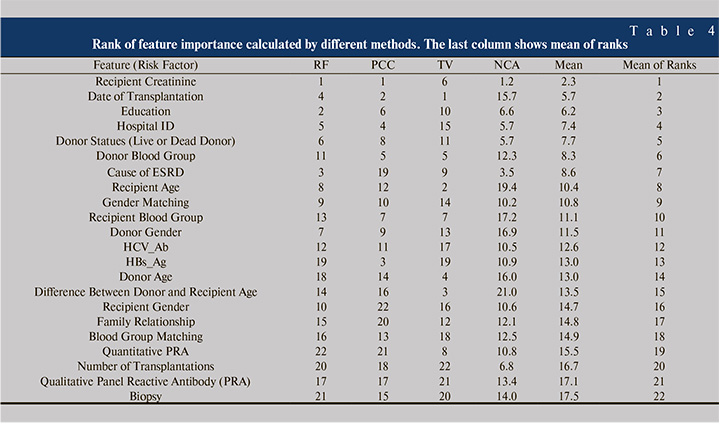
As seen from Table 4, the rank of features differs from one method to another, so the variables were ascendingly sorted by the mean ranks of different methods. Comparing Table 3 and Table 4 indicates that Creatinine, Donor State, Date of Transplantation, Cause of ESRD and Education are among 7 common important risk factors in both tables. Although investigation of important risk factors is not the main subject of this paper, but Table 3 and Table 4 may have valuable information about the important features. For example, both tables state that the gender matching is more important than the gender itself alone, which is compatible with previous studies [7]. However, the effect of male donor to female recipient or vice versa needs more investigation in future studies.
There may be other important features such as HLA antigen mismatch, BMI [5, 50, 68], country [9], center of transplantation like previous works [3, 31, 34-38, 69] and number of years on dialysis [4, 27], but these features were not included in the dataset of this study, hence their significance cannot be compared to that of creatinine. The results of this article can be used to extract rules or equations related to kidney functioning and efficiency of kidney transplantation [70-72].
Conclusion
In this study, a different set of features was used compared to those used in the literature to predict renal transplantation outcome. A Neural Networks model was proposed which achieved an accuracy, sensitivity and specificity equal to 86% (AUC=93%). The recipient creatinine in the last visit is the most important parameter, that affects the renal transplantation outcome. The MATLAB source code of the prediction algorithm is available in the supplementary section, so considering the good results of the model, using this prediction model before transplantation is strongly suggested.
List of abbreviations
ESRD: End-Stage Renal Disease; BMI: Body Mass Index; HLA: Human Leukocyte Antigen
eGFR: estimated Glomerular Filtration Rate; RBP: Retinol Binding Protein; CAN: Chronic Allograft Nephropathy; CIT: Cold Ischemic Time; AKI: Acute Kidney Injury; GFR: Glomerular Filtration Rate; ML: Machine Learning; ANN: Artificial Neural Network; HBsAg: Hepatitis B surface antigen; HCV-Ab: Hepatitis C Virus Antibody; PRA: Panel Reactive Antibody; MSE: Mean Squared Error; LOFO: Leave One Feature Out; MAE: Mean Absolute Error; SD: Standard Deviation; ROC: Receiver Operating Characteristic; AUC: Area Under Curve; PCC: Pearson Correlation Coefficient; TV: Term Variance; NCA: Neighborhood Component Analysis; ANFIS: Adaptive Neuro Fuzzy Inference System.
Declarations
Ethics approval and consent to participate
The study was approved by the ethics board of Shahid Beheshti University of Medical Sciences (No: IR.SBMU.MSP.REC.1397.518).
Consent for publication
Not applicable.
Availability of data and material
Please contact author for official data requests. All the MATLAB® source codes are available at: https://github.com/zanghaei/Renal-Survival-Prediction
Funding
This research was financially supported by “Research Department of the School of Medicine Shahid Beheshti University of Medical Sciences” (Grant No 13851).
Authors’ contributions
AZ carried out the major analyzing studies, like ANN, ZR provided the availability to data and participated in clinical inferences. AA participated in the design of study and ML analysis. MS performed the statistical analysis, HD, ASH, and AA participated in statistical inferences.
Acknowledgements
The authors are grateful to Shahid Beheshti University of Medical Sciences financial support and urology research center of Baghiyyatollah University and the Internal Department of Labbafinezhad Hospital for providing clinical data. Thanks to Dr. Sajad Shafiekhani for investigating the ANFIS (Adaptive Neuro Fuzzy Inference System) method.
Competing interests
The authors declare that they have no competing interests.